In HVAC systems, particularly in air handlers and packaged air conditioners, outside air (OA) and return air (RA) are blended before passing through the cooling or heating coils. The resulting mixed air temperature (MAT) is critical for coil load calculations, economizer operation, and overall system efficiency.
This article explains the concept, provides the calculation formula, and shows examples for different percentages of outside air and return air, and provides a free downloadable mixed air temperature calculator.
Why Mixed Air Temperature Matters
The MAT determines the entering conditions at the cooling or heating coil. For example:
Cooling Season: A higher MAT increases coil load and energy use.
Heating Season: A lower MAT increases heating demand.
Economizers: When outdoor conditions are favorable, more outside air is used to reduce mechanical cooling but they must be setup correctly to avoid wasting energy.
Accurately calculating MAT ensures coils are sized properly, economizer strategies are effective, and energy costs are minimized. This formula is based on dry bulb temperature.
The Formula for Mixed Air Temperature
The MAT is a weighted average based on the proportion of outside air and return air:
MAT = (%OA × OAT) + (%RA × RAT)
Where:
MAT = Mixed Air Temperature (°F or °C)
OAT = Outside Air Temperature (°F or °C)
RAT = Return Air Temperature (°F or °C)
%OA = Percentage of outside air
%RA = Percentage of return air (100 – %OA)
Example Mixed Air Temperature Calculations
Example 1: 20% Outside Air
Outside Air = 95°F
Return Air = 75°F
OA = 20%, RA = 80%
MAT = (0.20 × 95) + (0.80 × 75)
MAT = 19 + 60 = 79°F
Result: The coil sees 79°F entering air.
In this case since the outside air is way above the high limit for any economizer, the outside air would be set to the code minimum per ASHRAE 62.1. It makes no sense to waste energy on cooling outdoor air at 95°F when the return air is at 75°F, not considering relative humidity.
Example 2: 50% Outside Air
Outside Air = 40°F
Return Air = 72°F
OA = 50%, RA = 50%
MAT = (0.50 × 40) + (0.50 × 72)
MAT = 20 + 36 = 56°F
Result: The coil sees 56°F entering air.
Example 3: 75% Outside Air (Economizer Mode)
Outside Air = 70°F
Return Air = 75°F
OA = 75%, RA = 25%
MAT = (0.75 × 70) + (0.25 × 75) = 71°F
Result: The coil sees 71°F entering air. This may or may not be a good setup depending on the relative humidity of the outside air. If the outside air carries a higher latent load than the return air, then this could add significantly to the energy consumption as the coil will need to remove excessive moisture in a wet coil situation.
Example 4: 100% Outside Air (100% Economizer Mode)
Outside Air = 60°F
Return Air = 75°F
OA = 100%, RA = 0%
MAT = (1.0 × 60) + (0.0 × 75) = 60°F
Result: In full economizer mode, MAT = Outside Air Temp. This is where the economizer high limit strategy will come into consideration. See our next video on economizer control high limit strategies.
Practical Considerations
Energy Efficiency: Reducing OA percentage during extreme conditions lowers energy cost, while increasing OA during mild weather can reduce mechanical cooling.
Humidity (Enthalpy Method): While temperature-only calculations are common, true load calculations should also consider humidity. Mixed air enthalpy can be calculated similarly using a weighted average.
Sensor Placement: MAT sensors should be located downstream of the mixing box to avoid stratification errors.
Minimum Ventilation: Codes (ASHRAE 62.1, IMC) require minimum outside air for ventilation, typically ranging from 10–30% based on occupancy type and number of occupants.
Latent Heat Considerations
The mixed air temperature calculation shown here is based on a dry-bulb temperature average, which assumes the cooling coil is operating in a dry (sensible-only) condition. In climates or operating conditions where the coil is wet, this method can be misleading because it ignores the additional latent load of dehumidification. In those cases, a more accurate approach is to use differential enthalpy and differential dry-bulb control, which evaluates both sensible and latent energy. This ensures that economizer operation does not increase cooling energy use in humid conditions.
Get a free copy of our Mixed Air Temperature Calculator in the link below.
Heat pumps are everywhere these days — but did you know there’s a type of chiller that works as both a chiller and a boiler? Today, we’re breaking down modular air-to-water heat pump chillers — the future of all-electric heating and cooling. You have probably seen modular chillers which provide cooling only, but there are modular chillers that can do both cooling and heating. Here are the top 4 or 5 features:
# 1 Modular & Scalable Design
One of the standout features of these heat pump chillers is their modular design, allowing multiple units to be combined to meet varying building loads. Multiple units can easily fit on a flatbed truck and be off loaded using just a forklift. They also fit through the standard size doorway and into freight elevators for ease of rigging. Their compact design fits rooftops or urban sites.
Modular Heat Pump Chillers are easy to move and easily fit in a freight elevator.
Modules come in various sizes and are easily assembled to create larger tonnage systems. For instance, Trane’s Thermafit air-cooled model starts at 30 tons and can expand to 360 tons with up to 12 modules. Other manufacturers like YORK scale up to 4,480 tons with 32 modules, and LG’s reaches 300 tons with 5 modules. This scalability enables phased installation and easy expansion, making them ideal for new construction or retrofit projects where future growth is anticipated.
# 2 Redundancy
Redundancy in modular air-to-water heat pump chillers is a vital feature that ensures uninterrupted comfort and operational reliability, particularly in environments where HVAC failure is not an option. By requiring a minimum of two modules—such as the Trane AXM’s baseline configuration—these systems inherently provide a backup, allowing one unit to compensate if another malfunctions or requires maintenance.
Redundancy is an important feature for Modular Heat Pump Chillers. When one fails it can be fixed while the others run.
Independent controls on each module further enhance this redundancy, enabling selective operation or isolation without shutting down the entire system, as noted in Trane’s literature with features like independent defrost cycles and easy-change filters. This is especially important in critical settings like healthcare facilities, educational institutions, or commercial buildings with high occupancy, where maintaining a stable indoor climate is essential for safety, productivity, and compliance with stringent regulations. Additionally, the ability to expand up to 12 or more modules (e.g., Trane’s 360-ton capacity or YORK’s 4,480-ton potential) ensures that redundancy scales with capacity, offering peace of mind and resilience against equipment failures or load fluctuations.
# 3 Dual Function: Heating and Cooling
These units don’t just cool like a normal chiller. With a reversing valve, they can switch modes and produce either chilled water for cooling in summer, or hot water for heating in winter. That means one machine can do the job of both a chiller and a boiler — and all-electric, no gas required. Look for the multi-pipe version for a full four-pipe system that can do cooling and heating simultaneously.
# 4 Sustainability & Low-GWP Refrigerants
Because they’re all-electric, modular heat pump chillers help buildings meet decarbonization goals and comply with new energy codes. Many models use next-generation refrigerants like R-454B, which cuts global warming potential by about 75% compared to R-410A. This makes them a powerful step toward net-zero building design.”
# 5 Efficiency and Part-Load Operation
Efficiency is a cornerstone of these modular air-to-water heat pump chillers, particularly when multiple units operate at part load. Inverter-driven compressors and variable-speed fans allow each module to adjust its output (e.g., 15 to 100% capacity) based on real-time demand, optimizing energy use during off-peak conditions.
For instance, a system with several modules can stage operation—running fewer units at higher efficiency or distributing load across multiple units at lower capacities—reducing overall energy consumption compared to a single, oversized chiller running at partial load. This part-load efficiency is especially beneficial in buildings with fluctuating occupancy or seasonal variations, where maintaining comfort without waste is key.
Two-Pipe vs. Four-Pipe Systems
Some systems are two-pipe, which means they can provide heating or cooling, but not at the same time. Others are four-pipe, allowing simultaneous heating and cooling. That’s a game-changer for buildings like hospitals, hotels, and labs where you might need cooling inside while heating the perimeter at the same time.
Modular air-to-water heat pump chillers combine flexibility, efficiency, and sustainability in one package. They’re modular, scalable, all-electric, and cold-climate ready — making them a smart choice for the future of HVAC.
Noise in HVAC systems and ductwork is one of the most common complaints in offices, hospitals, schools, and homes. The good news? Once you understand the sources of HVAC noise and how sound travels, you can find the right fix. This guide explains the main causes of HVAC noise, defines breakout noise and sound paths, and shows you proven noise control solutions used by engineers and contractors. We’ll break it down step by step, starting with common symptoms to help you pinpoint the problem, followed by detailed explanations and mitigation strategies.
Step 1: Identifying the Noise You’re Hearing
Before diving into technical details, let’s help you diagnose what you might be experiencing. HVAC noises vary in character, and recognizing them can lead you directly to the source and solution:
Low-frequency humming or rumbling: This often comes from mechanical equipment like fans, pumps, or compressors vibrating or operating inefficiently. If it’s constant and felt as much as heard, check central units or air handlers.
High-pitched whistling or hissing: Typically caused by high air velocity through ducts, grilles, or vents. It might worsen when the system ramps up, indicating restricted airflow or undersized components.
Rattling or banging: Could stem from loose parts in ductwork, such as dampers or fittings, or from air turbulence in bends and transitions.
Mitigation Strategies for Noises through Return Air Plenum
Muffled thumping or booming: Often “breakout noise” where sound escapes through duct walls into rooms, especially in areas with thin or uninsulated ducts.
Echoing or amplified sounds: These suggest noise traveling along sound paths within the duct network, like from a rooftop unit down to occupied spaces.
By noting when the noise occurs (e.g., during startup, peak operation, or constantly), its location (near vents, in walls, or from the mechanical room), and its quality (steady vs. intermittent), you can narrow down the culprit. For instance, if the noise is louder near return air vents, it might involve air handlers or duct velocity issues. Once identified, the sections below provide targeted fixes.
Sources of Noise in HVAC Systems
Noise in HVAC systems primarily arises from two categories: mechanical equipment and airflow dynamics. Understanding these helps in troubleshooting.
Mechanical Equipment
HVAC systems rely on various components that generate noise through vibration, rotation, or fluid movement:
Fans and Air Handlers: Centrifugal or axial fans in air handlers create aerodynamic noise from blade turbulence and motor vibrations. A worn bearing might produce a grinding hum from imbalanced components or poor isolation from the building structure.
Pumps: Circulating water or refrigerants, pumps can cause cavitation noise (like bubbling) if air enters the system or if they’re improperly sized, they often cause humming or vibration through connected piping.
Compressors: In chillers or heat pumps, these produce pulsating sounds from gas compression cycles. Scroll compressors are quieter than reciprocating ones but can still vibrate.
Other equipment like boilers or condensers can contribute if mounted without vibration dampers. Vibrations transmit through floors or walls, amplifying the issue in multi-story buildings.
Air Velocity and Flow-Related Noise
High-speed air moving through ducts generates turbulence, especially at bends, restrictions, or outlets and inlets:
Turbulent Flow: Air speeds above 1,500 feet per minute (fpm) in ducts can create whooshing or roaring sounds, or it can be created by sharp duct elbows, undersized dampers, or poor transitions. Grilles and diffusers exacerbate this if undersized.
In residential settings, you might hear this as a persistent rush near vents; in commercial spaces, it could manifest as uneven noise distribution across floors.
Vibrations from fans, pumps, or compressors can travel along ducts and building structure, radiating as noise in occupied spaces.
Defining Breakout Noise and Sound Paths
To effectively address noise, it’s crucial to understand how it propagates.
Breakout Noise: This refers to sound that “breaks out” from the duct walls into surrounding spaces. Thin sheet metal can act like a speaker, amplifying fan or turbulence noise. It’s common in unlined ducts where vibrations radiate outward, often heard as a dull roar in adjacent rooms. Factors like duct material (e.g., flexible vs. rigid) and insulation thickness influence its severity.
Sound Paths: These are the routes noise takes through the system, including airborne paths (directly through air in ducts) and structure-borne paths (vibrations via mounts or connections). Flanking paths occur when noise bypasses barriers, such as through ceiling plenums or wall penetrations. In ductwork, primary paths include supply and return ducts, where noise travels from the source to outlets. Equipment rooms can leak noise through penetrations and walls.
Understanding paths helps in placing barriers strategically—for example, noise from a rooftop unit might follow vertical risers into offices below.
Solutions: How to Control HVAC Noise
Once you’ve identified the noise type and source, apply these proven techniques. Start with low-cost assessments like checking for loose parts, then escalate to engineering solutions.
Duct Sound Attenuators (Silencers): Installed in ducts, silencers absorb fan and airflow noise without drastically reducing air pressure. These are inline devices with absorptive baffles that reduce noise by 10 to 30 decibels. Install them near noisy equipment or branches to target breakout and airborne paths. Ideal for high-velocity systems; choose based on frequency (e.g., low-frequency for fans).
Return Air Duct Boots & Elbows: These fittings connect ducts to grilles and can be lined or shaped to minimize turbulence. Upgrading to acoustically treated boots reduces hissing at returns, especially in residential HVAC. Return air boots block direct “line-of-sight” transmission of sound from equipment rooms into occupied spaces or from one space to another as in side-by-side offices that use an unducted return air plenum.
Duct Liner and Duct Liner with Perforated Metal: Internal liners (fiberglass or foam) absorb sound waves, cutting breakout noise by up to 20 decibels. Perforated metal facings protect the liner while allowing sound penetration for absorption. Avoid using in high-moisture areas to prevent mold.
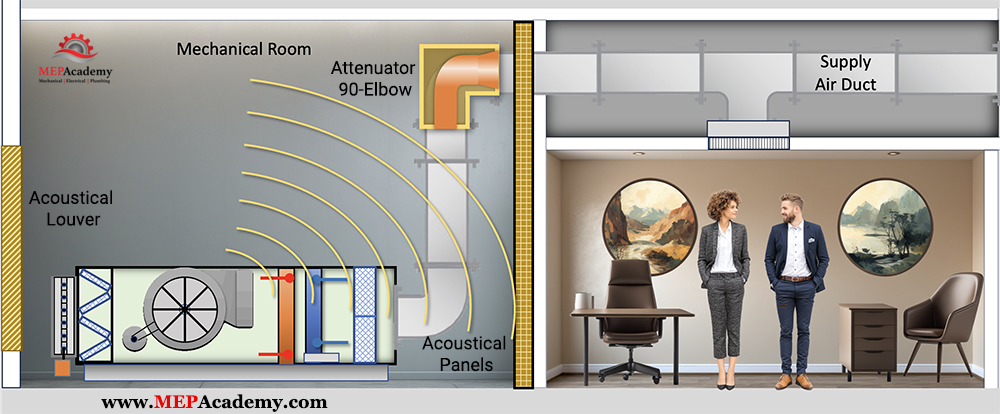
Acoustical Louver, Wall Panels and 90-Degree Elbow for HVAC Sound Control
Oversizing Ductwork and Grilles to Reduce Velocity: Lowering air velocity reduces whistling and rushing air noise. Larger ducts and diffusers provide quieter airflow. Design ducts and outlets larger than minimum to keep air speeds below 1,000 fpm, slashing airflow noise. For example, increasing grille size by 20% can halve velocity-related sounds. This is a preventive measure during installation or retrofits.
Sound Enclosures: Encasing noisy equipment like compressors or air handler’s cuts radiated sound significantly. These are box-like structures that surround equipment (e.g., compressors) with absorptive materials and vibration isolators. They contain noise at the source, effective for outdoor units or mechanical rooms, reducing transmission by 15 to 40 decibels. Look for Compressor Blankets.
Other tips: Flexible duct connectors, neoprene pads, and spring isolators keep vibration from traveling into the structure, ensure proper balancing of fans, and incorporate turning vanes in duct elbows to smooth airflow. Regular maintenance, like cleaning filters and lubricating parts, prevents noise escalation.
Other Important Information
Standards and Regulations: Adhere to guidelines like ASHRAE (American Society of Heating, Refrigerating and Air-Conditioning Engineers) standards for acceptable noise levels (e.g., NC-35 for offices). Local building codes may require noise assessments in sensitive areas like hospitals.
Professional Assessment: For complex issues, consult an acoustical engineer. Tools like sound level meters can quantify noise (aim for under 45 dBA in living spaces).
Energy Trade-offs: Some mitigations, like oversizing ducts, may increase energy use slightly, but benefits in comfort often outweigh this. Eco-friendly options include low-noise variable-speed fans.
Common Pitfalls: Ignoring return air paths can undermine efforts, as they often carry more noise. In retrofits, ensure mitigations don’t restrict airflow, which could strain the system.
Key Takeaways
1. Find the Source First: Match the noise characteristics (e.g., hum vs. whoosh) to sources like equipment, airflow velocity or vibration to target solutions effectively.
2. Prevent Propagation: Address breakout noise and sound paths with duct liners and sound attenuators to stop sound from spreading.
3. Air Velocity Matters: Oversizing ducts, grilles and other components reduces airflow noise without major overhauls.
4. Vibration must be isolated—use mounts, pads, and flexible connectors.
5. Maintain Regularly: Routine checks on vibrations and parts can prevent minor issues from becoming noisy problems.
Final Thoughts
Noise in HVAC systems isn’t just an annoyance—it impacts productivity, patient recovery, student concentration, and overall comfort. By identifying the type of noise and its path, you can select the right solution, from duct liners and silencers to enclosures and oversized ductwork.
A quiet HVAC system not only delivers comfort but also adds value to the building environment. If your system is too noisy, start with diagnosis—because the solution is often simpler than you think.
You’re lying in your hospital bed, feeling the weight of the day. The monitor beside you hums softly, and your nurse just left after saying, “The doctor has ordered a new medication for you.”
That’s where your part of the story usually ends — you wait, and a nurse eventually brings your treatment. But behind the scenes, an invisible chain of events is set into motion… one that winds through some of the cleanest, most controlled rooms in the entire hospital.
Step 1: The Doctor’s Order
Your doctor, after reviewing your charts, types an order into the hospital’s electronic system. That order doesn’t go to a regular shelf of pills or to the local Walgreens, CVS or Walmart, it goes to the hospital’s sterile compounding pharmacy, a place that operates under the strict rules of USP Chapter 797 within the hospital.
Step 2: The Pharmacy’s First Stop – The Anteroom
Your prescription first arrives in the pharmacy office and then heads to the anteroom. Think of it as the gateway to the sterile world — the border checkpoint where pharmacists and technicians prepare themselves before entering the cleanest areas.
In this space, staff wash their hands, put on sterile gowns, gloves, masks, and shoe covers. Air here is already cleaner than a typical hospital hallway, thanks to HEPA-filtered supply air and a constant flow of fresh, particle-free air replacing the old — around 20 air changes per hour and meeting ISO Class 7 standards.
Hospital Pharmacy HVAC Floor Plan
From an HVAC perspective, the anteroom is like a pressure dam. It’s designed to keep contaminants out of the next room by maintaining slightly higher air pressure, so clean air moves forward into the pharmacy, not the other way around.
Step 3: Inside the Buffer Room – The Cleanroom Heart
Once gowned, a pharmacy technician steps into the buffer room, also called the cleanroom. Here, the air is even purer, meeting ISO Class 7 standards. It feels still, calm — there’s no random breeze, no dust floating in the sunlight. That’s because 30 or more complete air changes per hour are continuously cycling through HEPA filters, sweeping particles down and out through low-wall returns.
The room is kept at positive pressure for non-hazardous compounding, meaning air always flows outward into less clean areas, never inward. This is the HVAC system acting as an invisible shield, protecting your medication from the tiniest airborne threats.
Step 4: The Primary Engineering Control
In the center of the buffer room or cleanroom sits the Primary Engineering Control — the star of the show. This could be a laminar airflow workbench or another ISO Class 5 device. Here, inside a bubble of unidirectional laminar airflow, the technician compounds your medication or IV.
Imagine clean air flowing in a smooth, even curtain from top to bottom. This air pushes away invisible particles before they can drift near your medication. This airflow is steady, precise, and uninterrupted. This is because even a wave of a hand in the wrong way could disturb it.
Step 5: Final Check and Delivery
Once prepared, your medication is sealed, labeled, and moved back through the anteroom. In many cases, it’s delivered via a pneumatic tube system or hand-carried to the nurse’s station. From there, it arrives at your bedside — the only part you usually see.
Why This Matters to You as a Patient
As you watch the nurse connect the IV line or hand you a small cup of pills, it’s easy to miss the fact that an entire team of professionals — and an intricate HVAC-controlled environment — worked behind the scenes to make sure it’s safe, sterile, and exactly what you need.
Every room — from the anteroom to the buffer room, to the primary engineering control — is designed for one goal: to protect you. And the air itself, invisible and silent, is one of the most important medicines in the room.