


The first two pieces of information that you’ll need to enter on a Pump Chart are the flow (GPM) and the pressure (Head). We’ll tell you how engineers get these two important pieces of information and explain all the curves you’ll find on a pump chart. First we’ll show you quickly all the different curves and lines, then for those who want further explanation we include that further in the article.
If you Prefer to Watch the Video, then scroll to the end of this article for the Video on How to Read Pump Curves.
Hydronic Pumps are used in the HVAC industry to move water that has either been heated or cooled to condition occupied spaces, or water for heat rejection equipment. There are various types of pumps used from end-suction pumps to inline-pumps using a variety of materials like cast iron, bronze, or stainless steel. Pumps can be secured in sizes for the smallest projects requiring a few GPM, to large projects requiring many pumps and thousands of GPM.
Pump Chart Basics
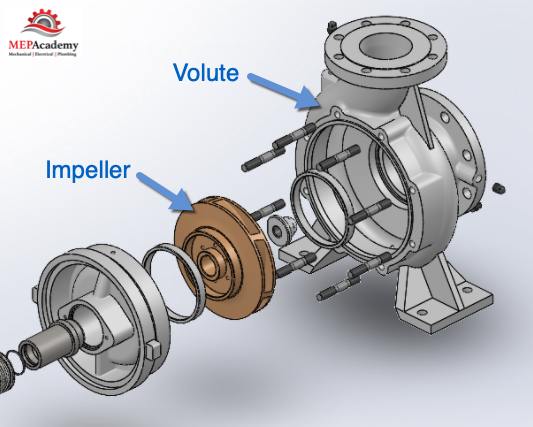
Reading a pump chart is very simple once you know the basics of what information to look for and what the charts are telling you. What you’re really looking at is a pump selection curve or pump impeller size curve. The pump curve is really the size of the impeller within the volute of that pump model.
As the size of the impeller changes within the same volute and model number of the pump, there will be another pump curve for that impeller size with different performance results. The pump will always be performing at some point on this curve. Here are the curves of a pump chart that we will discuss later.
- Pump Curve, also called Head Curve, Impeller Size Curve, Head/Flow Curve
- Flow (GPM)
- Head Pressure (TDH)
- Efficiency lines and (BEP)
- Horsepower Lines (HP)
- Variable Speed Curves (RPM) – Curve not shown on this chart
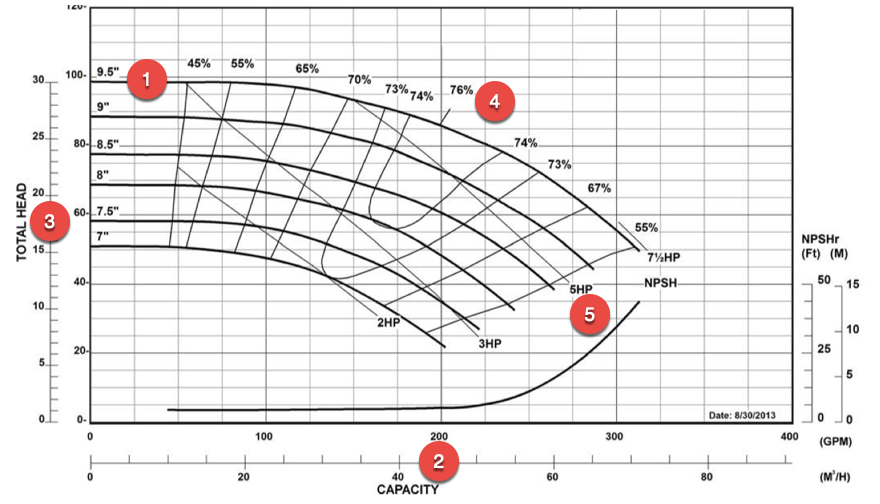
With most charts you’ll have flow (GPM) on the “X” axis while Total Head Pressure will be on the “Y” axis with various other curves representing the HP (horsepower) of the motor, Efficiency, and impellor trim size.
Each pump curve you see is related to a particular pump manufacture and model number. Every pump make and model will have a different pump curve which applies for a certain RPM and Impeller diameter.
The pump must move the quantity of water in Gallons per Minute (GPM) or Liters per Second (LPS) required by producing enough head pressure to overcome the resistance of the pipe, valves, fittings, components and coils within the system including the height the fluid most be moved.
The amount of water moved (GPM) or (LPS) is based on the speed of the pump, impeller size and head pressure.
Pump Curve, Head Curve, Impeller Size Curve, Head/Flow Curve
The Pump curve goes by various names. Looking at the Impeller lines we see that there are several different sizes, each with its own curve. This pump chart covers a certain make and model number which allows you to order different size impellers. It’s like ordering your favorite soda and having to choose the size of the cup, small, medium, large or big gulp.
You can see from the chart above that you have the option of ordering this pump with the following sizes of impellers; 7”, 7-1/2”, 8”, 8-1/2”, 9” and 9-1/2”. This gives you plenty of options when selecting a pump. Now lets look at another set of lines.
Water Flow Rate (GPM)
The water is used to transfer heat either into or out of an occupied space or for a process. This is accomplished by various methods such as chilled water, heating hot water or Condenser Water. Each gallon of water carries various amounts of heat depending on its temperature. So, when we discuss pumps, we need to know how much water (Gallons) that needs to be moved to the equipment in a minute, hence GPM (Gallons per Minute), or LPS (Liters per Second).
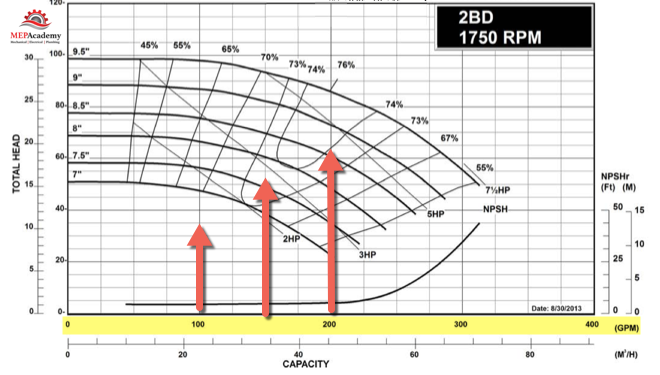
As you can see on the pump chart above the flow (GPM) is represented by the vertical lines and the values are on the “X” axis along the bottom of the chart, highlighted in yellow.
Here is the formula for determining GPM. First you need to determine the heating or cooling load from doing a load calculation on the building and coming up with the required btu/hr needed at the peak for a particular zone being sized. Lets say our total tonnage for the building at peak load is 90 Tons and we’re designing with a 10F Delta-T.
Q = GPM x 500 x Delta-T or GPM = Q / 500 x Delta-T
Q = Btu/Hr
500 = Constant, 60min/hr x 8.33 lb/gal x Specific Gravity(1) x Specific Heat(1)
Delta-T = Design Temperature Difference in water
GPM = (90 ton x 12,000 btu/ton) / 500 x Delta-T
GPM = (1,080,000 Btu) / 5,000 = 216 GPM
Total Head Pressure
There are three terms of measurement in the total head of a fluid system: static pressure (gauge pressure), height (or potential energy), and velocity head (or kinetic energy). The head pressure of the pump is what gets the water to flow in the designed amount against the friction in the system and any static head.
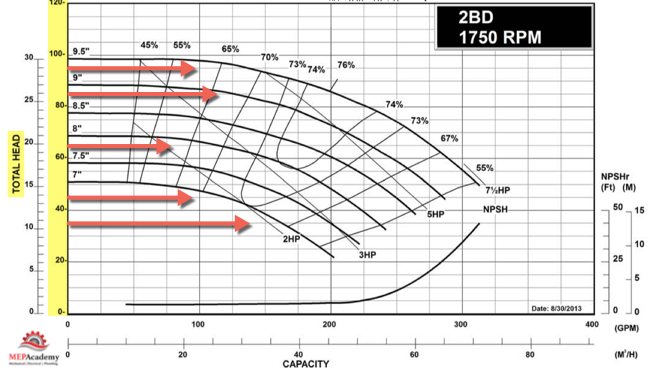
The lines for “Total Head” run horizontally across the chart depending on the head pressure from 0 to 120 feet for this chart. The head pressure values run on the “Y” axis along the left hand side of the chart. When selecting a pump you’ll use the GPM and Total Head as the starting points. But before we get to that lets explain the rest of the lines.
Efficiency lines and (BEP)
The efficiency lines or curves reflect the efficiency of the pump when operating in the ranges shown. The higher the value the more efficient the pump is at those conditions.
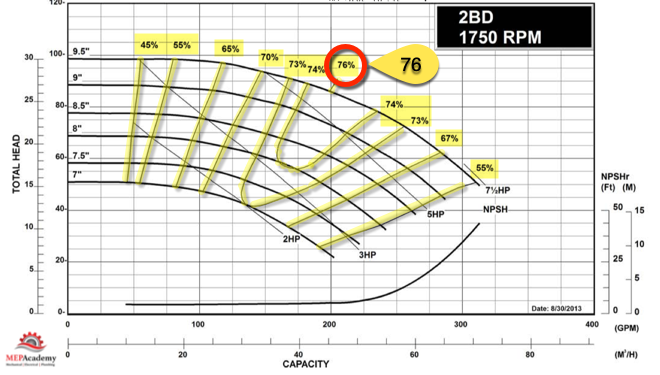
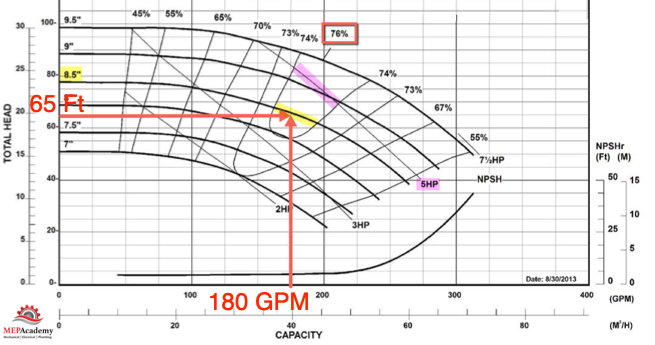
The greatest efficiencies are near the middle of the impeller curves. In this example you can see that 76% efficiency is the best this pump can do. This is the area you want to design for to achieve maximum energy efficiency. Efficiency runs from a low of 45% to a high of 76%. You never want to choose a pump that is far left or right of the Best Efficiency Point (BEP), which is in proximity to 76%.
Horsepower Lines (HP)
The horsepower lines indicate the size of the motor required to achieve the desired pump operation.
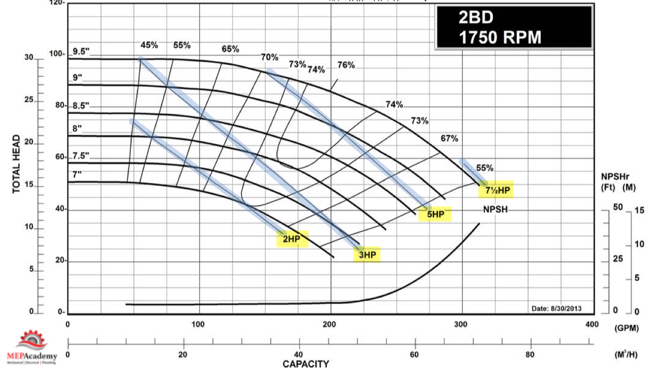
The horsepower lines run diagonally across the chart and have the following four options for motor sizes. 2 Hp, 3 Hp, 5 Hp or 7-1/2 Hp.
Now that we have covered the basics lines and curves found on a pump chart we can dive into more detail for those who want to know more about each of these.
Performance Curve
This curve represents the pump manufacturer’s test results for where this pump will perform under varying conditions of water flow (GPM) and Head Pressure (Ft). These are the “X” and “Y” axis on the pump chart. If you change the GPM, then the performance curve will tell you what you’ll get in head pressure that corresponds that flow requirement.
Each pump make and model will have their own pump chart and pump curve showing where this performance curve is on the chart. The mechanical engineer’s job is to pick the right pump for the right conditions. Often the best place to select a pump is midpoint on the curve.
Characteristics of the Pump Curve
Looking at pump curves you’ll notice some to appear flatten out, while others have a larger arch to them. When selecting pumps for closed HVAC systems it’s best to pick pumps with flatter curves. Pumps that have flat curves allow for greater range of flow with less change in head pressure. Steep curves will have greater reduction in head pressure as you increase flow (GPM).
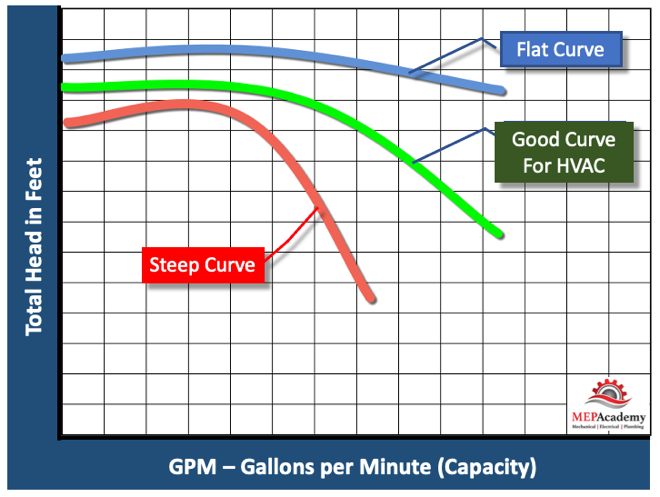
In a closed-circuit system, flat curves are preferrable because large changes in capacity will have a small impact on head pressure. The opposite is true of a steep pump curve, so that when you have a capacity increase you have a corresponding dramatic drop in head pressure. A flat pump curve provides for a more stable operation and control. You can understand how a flat curve is advantages when balancing multiple circuits, so that after each adjustment to one circuit there isn’t a major change in the other circuits.
Family of Pump Curves
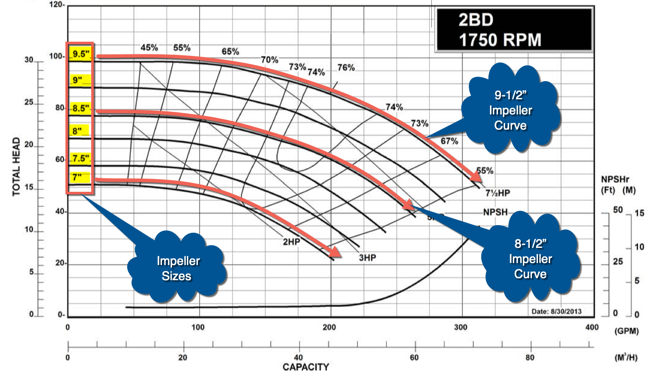
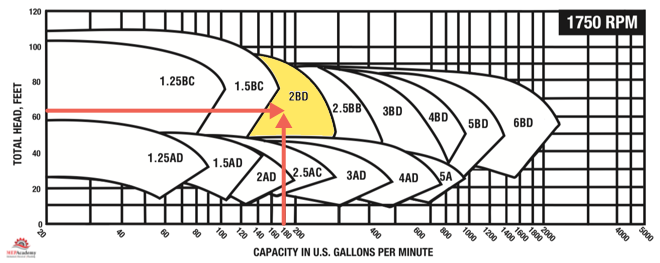
Pump manufacturers use pump coverage maps to help you quickly identify which pump model best fits into your design parameter of flow and head pressure. As shown below using 180 GPM (681 Liters/Min) at 65 Feet (19.8 meters) of Head, the family of Pump Curves directs us to a particular model “2BD”. The overlap of some of these is due to various impeller sizes that are available for each model.
Pump Impeller Size
There are several options to get more out of one model of pump. One option is to change the size of the pump’s impeller. You’ll see several performance curves on the pump chart, one for each size of impeller available for that pump’s volute. By increasing the impellor size, the pump will provide greater flow (GPM).
If your selection falls within two sizes, there is an option to have the impeller trimmed to fine tune the selection point. Trimming is often done to impellers of existing pumps possibly due to initially being over-sized which causes energy to be wasted by pumping more water then needed or adding resistance (Head Pressure) by throttling. The impeller is machined to reduce its size to closely fit the actual operating conditions.
System Curve
The system curve must intersect the pump curve for proper operation of the pump. The engineer will design the pump for a flow rate (GPM) and Head Pressure based on the pressure losses of a fixed HHW or CHW piping circuit. Any changes in flow will have a resulting change in pressure that follows this system curve.
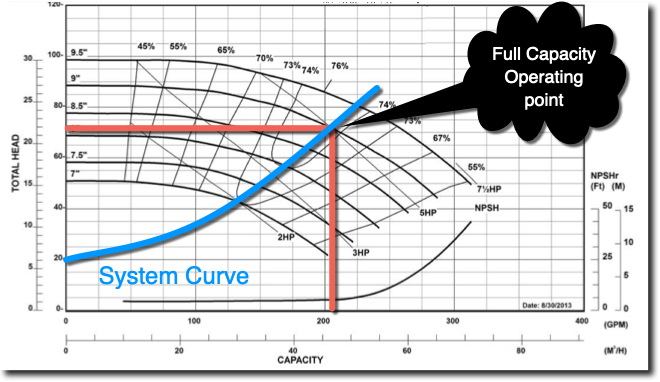
in the example above you can see that the system curve at its full operating capacity intersects the 9 inch impeller size curve giving a pump efficiency of approximately 75%, and a 5 Horsepower motor. This was derived from the system requirement of 205 GPM at 77 Feet of Head.
Reading Pump Gauges to Determine Head Pressure
From the suction and discharge gauge readings you can determine the feet of head at that current operating point. If the system is running at full load then this should give a good indication of the pumps head pressure capabilities. In the image below you can see that the suction pressure on the gauge is 90 psi, while the discharge pressure is 130 psi. Using some basic math we can convert psi into feet of head.
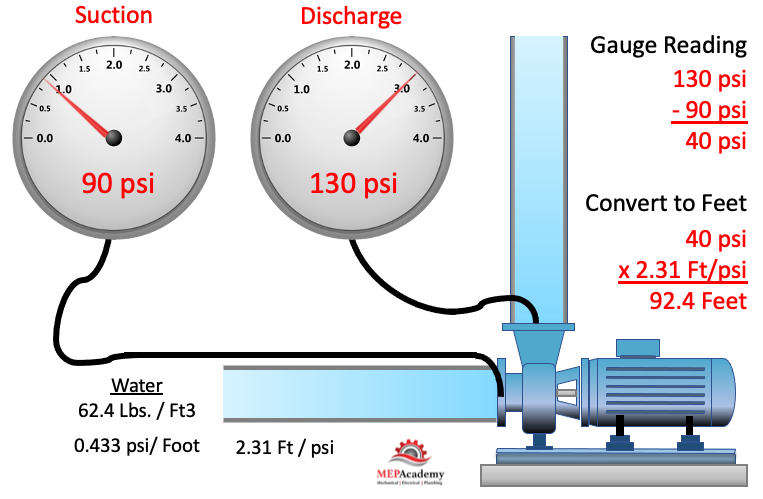
The difference between the discharge and suction pressure gauge readings is 40 psi. To turn this into feet we need to use the conversion factor of 2.31 Ft/psi. By multiplying the differences in the gauges by 2.31 we get the head pressure of 92.4 Feet of Head.
You can use this pump differential pressure to derive at the pumps total head and then apply the results to the pump curve.
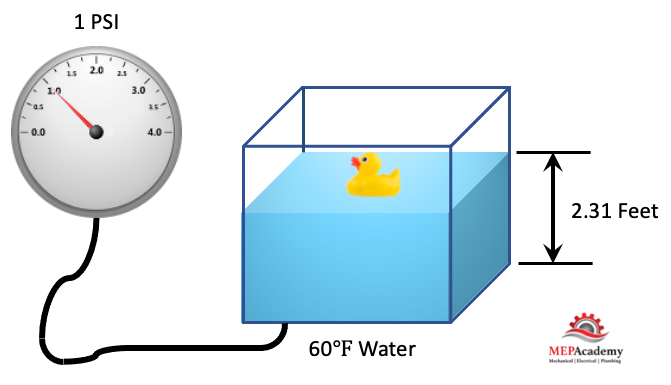
We measure this pressure in PSI (Pounds per Square Inch) or as Feet of Head. Their relationship is as follows: 1 PSI = 2.31 feet of Head.
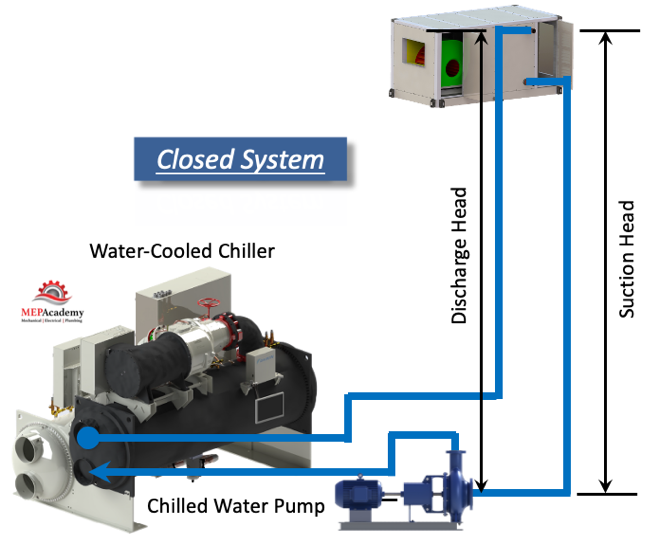
Closed Loop Circuit
In a closed loop system the water moves around in a loop from supply to return and back. At no point does the water leave the system and become exposed to the atmosphere. Pumps that are used in closed loop systems, like chilled water, heating hot water, and closed loop condenser water systems, don’t usually need to worry about static pressure.
The reason static pressure is often not a factor is that the supply and return pipes run the same height, and one cancels out the other in static pressure. The predominate pressure loss in closed loop systems come from friction create by the flow (GPM) passing through pipes, valves, fittings and system components like coils.
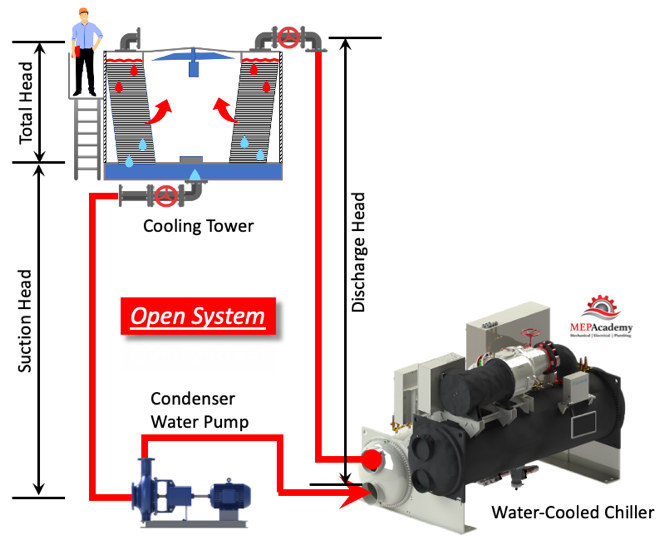
Open Loop Head Pressure Calculation (CDW)
In an open system, the most common in the HVAC industry being the cooling tower condenser water. Condenser water is used to remove heat from the chillers condenser and reject this heat at the tower. The pump has to consider the difference in height between the supply and return water systems as they are not equal in vertical length.
The vertical rise on the suction side of the pump goes to the cooling towers cold water basin water level, while the discharge side of the pump goes to the distribution nozzles or water outlet at the top of the cooling tower. The difference between these two levels will be added to the pumps head.
This is the indication of the pumps ability to overcome two things:
- The vertical height of the piping including static lift if applicable
- Friction losses caused by friction in pipe, valves, and fittings.
The vertical height is determined by taking the difference in height between the water’s lowest and highest point in the system. Static lift is when the suction side of the pump has to pull liquid up from floors below.
The friction losses are determined by adding up all the friction lost from the pipe, valves, fittings and equipment. Friction loss is based on the type of pipe, size of pipe and the amount of water moving through the pipes. You will need to know the total length of pipe in the system per size including the equivalent length for fittings and accessories, along with the flow (GPM) going through the system.
This chart shows the maximum efficiency occurring midway on the pump curve which is the ideal spot to pick the pump for efficiency for hydronic pumps. Making sure not to oversize the pump is crucial to avoid an energy penalty as reflected by the energy efficiency curves.
When selecting a closed loop pump be sure to select at the best efficiency point (BEP). This is the point on the pump curve where the pump operates at optimum efficiency for the impeller size, flow rate and head pressure for a particular pump model.
To the Operating Point or Non-Overloading
Pumps should be selected as non-overloading over the entire pump curve. This characteristic is most important for hydronic system operation, especially when pumps are to be used in parallel or when the pump operating point is relatively indeterminate and subject to shift; as in the normal heating-air conditioning application. – B&G
Net Positive Suction Head (NPSH) Curve
Net Positive Suction Head is mostly used when designing pumps for open systems like cooling tower pumps where they draw water from an open cold-water basin. The basin is open to the atmospheric pressure. If the tower is properly designed, then NPSH evaluation is not required. The pump requires NPSH to prevent cavitation and to operate properly. Cavitation will adversely affect pump efficiency and potentially damage the pump.
Variable Frequency Drives
Systems that require variable flow will benefit from using Variable Frequency Drives (VFD’s) on their pump motors to save energy. As the demand of the system flow (GPM) is reduced so is the speed (RPM) of the pump motor which better matches the energy required at that time. This reduces energy consumption and avoids wasteful strategies like throttling or bypassing excessive flow.
VFD’s are common in large chilled water or heating hot water systems as there is often opportunities to slow down the pumps to meet the reduced load on the buildings cooling or heating system. As the building load varies, so to can the pump speed (RPM). In systems with high static head there is a need to ensure that the pump doesn’t operate too slowly against the high-static head conditions.
Horsepower is directly related to speed as dictated by the Pump Affinity Laws.
Bhp2 = Bhp1 x (rpm2 / rpm1)3
Pump Selection Criteria
In addition to flow (GPM), some of the decisions that the Mechanical Engineer will need to determine are:
- Is the pump to be installed in a closed or open system?
- Will more than one pump be required?
- Are the pumps to be constant or variable speed?
- How will the pumps be arranged, in series or parallel configuration?
- What is the design velocity of water in piping?
- Size the piping and determine friction rate per 100 feet of pipe.
- What is the pressure loss through the piping systems caused by friction from the pipe, valves, fittings, and other components, such as coils?
- Determine the circuit with the highest pressure drop.
- Does static lift or static pressure need to be included?
An open system occurs when using a cooling tower with a cold-water sump open to atmospheric pressure to reject the heat from a water-cooled chiller. A closed loop system is your typical heating hot water, chilled water system, or condenser water for water cooled equipment.
Pump Selection Software
To reduce the complexity of selecting pumps most manufacturers have developed software that will assist the engineer in selecting the right pump for the application. By entering the flow (GPM), head (FT), speed (RPM) and other fluid properties the software will generate a list of potential pumps that meet the entered criteria. You’ll then be able to view the various pump curves that match your selection.
https://www.esp-systemwize.com/pumps
